The cumulative value of merchandise exports during April-January2024-25 was USD 358.91 Billion, as compared to USD 353.97 Billion during April-January2023-24, registering a positive growth of 1.39%.
Non-Petroleum exports in January2025 valued at USD 32.86Billion registered an increase of14.47% as compared to USD 28.71Billion in January2024.
The cumulative Non-Petroleum exports in April-January2024-25 valued at USD 305.84Billion registered an increased of7.90% as compared to USD 283.45Billion in April-January2023-24.
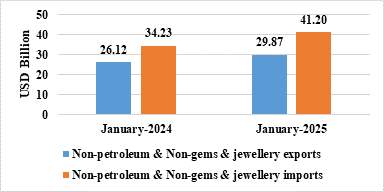
Non-petroleum & Non-Gems & Jewellery exports registered an increase of 14.33% from USD 26.12 Billion in January2024 to USD 29.87 Billion in January2025.
Major drivers of merchandise exports growth in January2025 include Electronic Goods, Engineering Goods, Drugs & Pharmaceuticals, Rice and Gems & Jewellery.
Electronic Goods exports increased by 78.97 % from USD 2.29 Billion in January2024 to USD 4.11 Billion in January2025.
Engineering Goods exports increased by 7.44 % from USD 8.77 Billion in January2024 to USD 9.42 Billion in January2025.
Drugs & Pharmaceuticals exports increased by 21.46 % from USD 2.13 Billion in January2024 to USD 2.59 Billion in January2025.
Rice exports increased by 44.61 % from USD 0.95 Billion in January2024 to USD 1.37 Billion in January2025.
Gems & Jewellery exports increased by 15.95 % from USD 2.59 Billion in January2024 to USD 3 Billion in January2025.
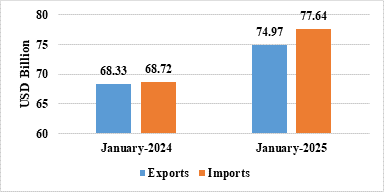
- India’s total exports (Merchandise and Services combined) for January2025* is estimated at USD 74.97 Billion, registering a positive growth of 9.72 percent vis-à-vis January2024.Total imports (Merchandise and Services combined) for January2025* is estimated at USD 77.64 Billion, registering a positive growth of 12.98 percent vis-à-vis January2024.
Table 1: Trade during January2025*
|
|
|
January2025
(USD Billion)
|
January2024
(USD Billion)
|
|
Merchandise
|
Exports
|
36.43
|
37.32
|
|
Imports
|
59.42
|
53.88
|
|
Services*
|
Exports
|
38.55
|
31.01
|
|
Imports
|
18.22
|
14.84
|
|
Total Trade
(Merchandise +Services) *
|
Exports
|
74.97
|
68.33
|
|
Imports
|
77.64
|
68.72
|
|
Trade Balance
|
-2.67
|
-0.39
|
* Note: The latest data for services sector released by RBI is for December2024. The data for January2025 is an estimation, which will be revised based on RBI’s subsequent release. (ii) Data for April-January2023-24 and April-September2024 has been revised on pro-rata basis using quarterly balance of payments data.
Fig 1: Total Trade during January2025*
- India’s total exports during April-January2024-25* is estimated at USD 682.59 Billion registering a positive growth of 7.21 percent. Total imports during April-January2024-25* is estimated at USD 770.06 Billion registering a growth of 8.96 percent.
Table 2: Trade during April-January2024-25*
|
|
|
April-January2024-25
(USD Billion)
|
April-January2023-24
(USD Billion)
|
|
Merchandise
|
Exports
|
358.91
|
353.97
|
|
Imports
|
601.90
|
560.27
|
|
Services*
|
Exports
|
323.68
|
282.71
|
|
Imports
|
168.17
|
146.48
|
|
Total Trade
(Merchandise +Services) *
|
Exports
|
682.59
|
636.69
|
|
Imports
|
770.06
|
706.75
|
|
Trade Balance
|
-87.47
|
-70.06
|
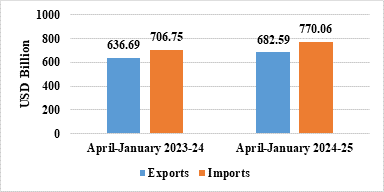
Fig 2: Total Trade during April-January2024-25*
MERCHANDISE TRADE
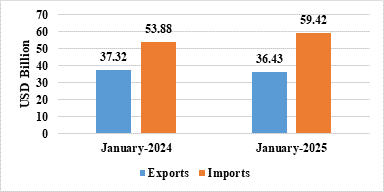
- Merchandise exports during January2025 were USD 36.43 Billion as compared to USD 37.32 Billion in January2024.
- Merchandise imports during January2025 were USD 59.42 Billion as compared to USD 53.88 Billion in January2024.
Fig 3: Merchandise Trade during January2025
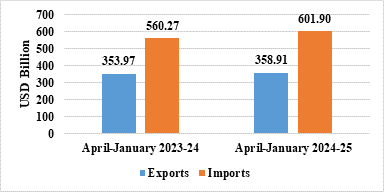
- Merchandise exports during April-January2024-25 were USD 358.91 Billion as compared to USD 353.97Billion during April-January2023-24.
- Merchandise imports during April-January2024-25 were USD 601.90 Billion as compared to USD 560.27 Billion during April-January2023-24.
- Merchandise trade deficit during April-January2024-25 was USD 242.99 Billion as compared to USD 206.29 Billion during April-January2023-24.
Fig4: Merchandise Trade during April-January2024-25
- Non-petroleum and non-gems & jewellery exports in January2025 were USD 29.87Billion compared to USD 26.12Billion in January2024.
- Non-petroleum, non-gems & jewellery (gold, silver & precious metals) imports in January2025 were USD 41.20Billion compared to USD 34.23Billion in January2024.
Table 3: Trade excluding Petroleum and Gems & Jewellery during January2025
|
|
January2025
(USD Billion)
|
January2024
(USD Billion)
|
|
Non- petroleum exports
|
32.86
|
28.71
|
|
Non- petroleum imports
|
45.99
|
38.35
|
|
Non-petroleum & Non-Gems & Jewellery exports
|
29.87
|
26.12
|
|
Non-petroleum & Non-Gems & Jewellery imports
|
41.20
|
34.23
|
Note: Gems & Jewellery Imports include Gold, Silver & Pearls, precious & Semi-precious stones
Fig 5: Trade excluding Petroleum and Gems & Jewellery during January2025
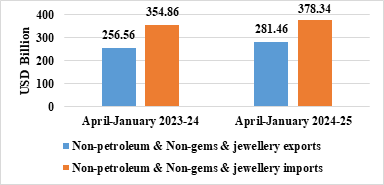
- Non-petroleum and non-gems & jewellery exports in April-January2024-25 were USD 281.46 Billion, compared to USD 256.56 Billion in April-January2023-24.
- Non-petroleum, non-gems & jewellery (gold, silver & precious metals) imports in April-January2024-25 were USD 378.34 Billion, compared to USD 354.86 Billion in April-January2023-24.
Table 4: Trade excluding Petroleum and Gems & Jewellery during April-January2024-25
|
|
April-January2024-25
(USD Billion)
|
April-January2023-24
(USD Billion)
|
|
Non- petroleum exports
|
305.84
|
283.45
|
|
Non- petroleum imports
|
447.06
|
414.77
|
|
Non-petroleum &Non Gems& Jewellery exports
|
281.46
|
256.56
|
|
Non-petroleum & Non Gems & Jewellery imports
|
378.34
|
354.86
|
Note: Gems & Jewellery Imports include Gold, Silver & Pearls, precious & Semi-precious stones
Fig 6: Trade excluding Petroleum and Gems & Jewellery during April-January2024-25
SERVICES TRADE
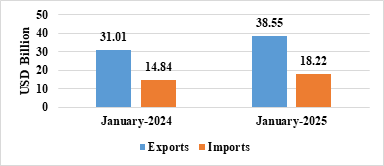
- The estimated value of services export for January2025* is USD 38.55 Billion as compared to USD 31.01Billion in January2024.
- The estimated value of services imports for January2025* is USD 18.22 Billion as compared to USD 14.84Billion in January2024.
Fig 7: Services Trade during January2025*
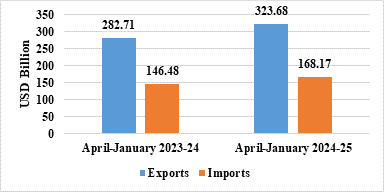
- The estimated value of service exports during April-January2024-25* is USD 323.68 Billion as compared to USD 282.71 Billion in April-January2023-24.
- The estimated value of service imports during April-January2024-25* is USD 168.17 Billion as compared to USD 146.48 Billion in April-January2023-24.
- The services trade surplus for April-January2024-25* is USD 155.52 Billion as compared to USD 136.23 Billion in April-January2023-24.
Fig 8: Services Trade during April-January2024-25*
- Exports ofOther Cereals (103.2%), Electronic Goods (78.97%), Tobacco (59.18%), Coffee (57.07%), Rice (44.61%), Jute Mfg. Including Floor Covering (40.67%), Meat, Dairy & Poultry Products (35.66%), Mica, Coal & Other Ores, Minerals Including Processed Minerals (27.71%), Tea (21.97%), Drugs & Pharmaceuticals (21.46%), Handicrafts Excl. Hand Made Carpet (19.49%), Carpet (18.04%), Cotton Yarn/Fabs./Made-Ups, Handloom Products Etc. (16.41%), Gems & Jewellery (15.95%), Plastic & Linoleum (13.31%), Man-Made Yarn/Fabs./Made-Ups Etc. (12.14%), Rmg Of All Textiles (11.45%), Cereal Preparations & Miscellaneous Processed Items (11.13%), Ceramic Products & Glassware (10.44%), Marine Products (7.98%), Engineering Goods (7.44%), Cashew (6.85%), Leather & Leather Products (6.37%), Spices (2.32%) and Fruits & Vegetables (0.81%) record positive growth during January2025 over the corresponding month of last year.
- Imports of Project Goods (-48.14%), Pearls, Precious & Semi-Precious Stones (-29.11%), Coal, Coke & Briquettes, Etc. (-15.22%) and Petroleum, Crude & Products (-13.49%) record negative growth during January2025 over the corresponding month of last year.
- Services exports is estimated to grow by 14.49percent during April-January2024-25* over April-January2023-24.
- Top 5 export destinations, in terms of change in value, exhibiting positive growth in January2025 vis a vis January2024 are U S A (39.02%), Japan (53.53%), Bangladesh Pr (17.27%), U K (14.84%) and Nepal (20.84%).
- Top 5 export destinations, in terms of change in value, exhibiting positive growth in April-January2024-25 vis a vis April-January2023-24 are U S A (8.95%), U Arab Emts (6.82%), Netherland (9.17%), U K (14.17%) and Japan (21.12%).
- Top 5 import sources, in terms of change in value, exhibiting growth in January2025 vis a vis January2024 are China P Rp (17.06%), Thailand (136.63%), U S A (33.46%), Germany (72.15%) and U K (101.62%).
- Top 5 import sources, in terms of change in value, exhibiting growth in April-January2024-25 vis a vis April-January2023-24 are U Arab Emts (35.58%), China P Rp (10.6%), Russia (7.17%), Switzerland (16.61%) and Thailand (32.59%).
*Link for Quick Estimates