| News | |||||||||||||||||||||||||||||||||||||||||||||||||||||||||||||||||||||||||||||||||||||||
|
Home |
|||||||||||||||||||||||||||||||||||||||||||||||||||||||||||||||||||||||||||||||||||||||
|
|
|||||||||||||||||||||||||||||||||||||||||||||||||||||||||||||||||||||||||||||||||||||||
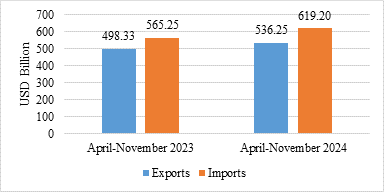
The cumulative overall exports during April-November 2024 is estimated at USD 536.25 Billion, as compared to USD 498.33 Billion in April-November 2023, with an estimated growth of 7.61%. |
|||||||||||||||||||||||||||||||||||||||||||||||||||||||||||||||||||||||||||||||||||||||
| 16-12-2024 | |||||||||||||||||||||||||||||||||||||||||||||||||||||||||||||||||||||||||||||||||||||||
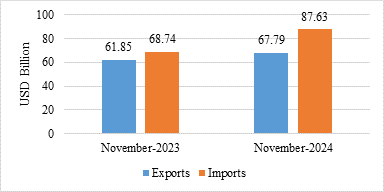
The cumulative value of merchandise exports during April-November 2024 was USD 284.31 Billion, as compared to USD 278.26 Billion during April-November 2023, registering a positive growth of 2.17%. India’s total exports (Merchandise and Services combined) for November 2024* is estimated at USD 67.79 Billion, registering a positive growth of 9.59 percent vis-à-vis November 2023. Total imports (Merchandise and Services combined) for November 2024* is estimated at USD 87.63 Billion, registering a positive growth of 27.47 percent vis-à-vis November 2023. Table 1: Trade during November 2024*
* Note: The latest data for services sector released by RBI is for October 2024. The data for November 2024 is an estimation, which will be revised based on RBI’s subsequent release. (ii) Data for April-November 2023 and April-June 2024 has been revised on pro-rata basis using quarterly balance of payments data. Fig 1: Total Trade during November 2024*
India’s total exports during April-November 2024* is estimated at USD 536.25 Billion registering a positive growth of 7.61 percent. Total imports during April-November 2024* is estimated at USD 619.20 Billion registering a growth of 9.55 percent. Table 2: Trade during April-November 2024*
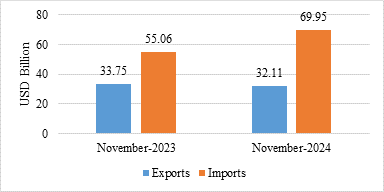
Fig 2: Total Trade during April-November 2024* MERCHANDISE TRADE Merchandise exports during November 2024 were USD 32.11 Billion as compared to USD 33.75 Billion in November 2023. Merchandise imports during November 2024 were USD 69.95 Billion as compared to USD 55.06 Billion in November 2023. Fig 3: Merchandise Trade during November 2024
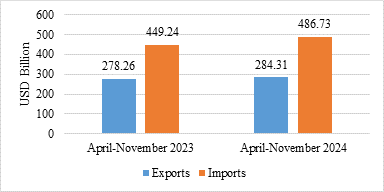
Merchandise exports during April-November 2024 were USD 284.31 Billion as compared to USD 278.26 Billion during April-November 2023. Merchandise imports during April-November 2024 were USD 486.73 Billion as compared to USD 449.24 Billion during April-November 2023. Merchandise trade deficit during April-November 2024 was USD 202.42 Billion as compared to USD 170.98 Billion during April-November 2023. Fig 4: Merchandise Trade during April-November 2024
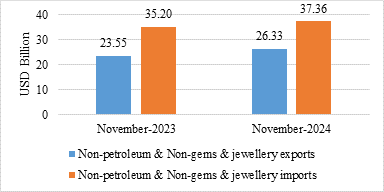
Non-petroleum and non-gems & jewellery exports in November 2024 were USD 26.33 Billion compared to USD 23.55 Billion in November 2023. Non-petroleum, non-gems & jewellery (gold, silver & precious metals) imports in November 2024 were USD 37.36 Billion compared to USD 35.20 Billion in November 2023. Table 3: Trade excluding Petroleum and Gems & Jewellery during November 2024
Note: Gems & Jewellery Imports include Gold, Silver & Pearls, precious & Semi-precious stones Fig 5: Trade excluding Petroleum and Gems & Jewellery during November 2024
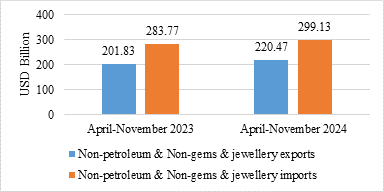
Non-petroleum and non-gems & jewellery exports in April-November 2024 were USD 220.47 Billion, compared to USD 201.83 Billion in April-November 2023. Non-petroleum, non-gems & jewellery (gold, silver & precious metals) imports in April-November 2024 were USD 299.13 Billion, compared to USD 283.77 Billion in April-November 2023. Table 4: Trade excluding Petroleum and Gems & Jewellery during April-November 2024
Note: Gems & Jewellery Imports include Gold, Silver & Pearls, precious & Semi-precious stones Fig 6: Trade excluding Petroleum and Gems & Jewellery during April-November 2024
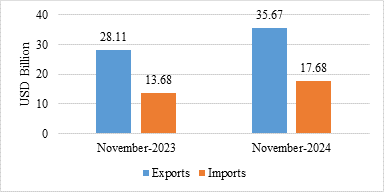
SERVICES TRADE The estimated value of services export for November 2024* is USD 35.67 Billion as compared to USD 28.11 Billion in November 2023. The estimated value of services imports for November 2024* is USD 17.68 Billion as compared to USD 13.68 Billion in November 2023. Fig 7: Services Trade during November 2024*
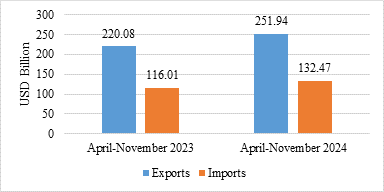
The estimated value of service exports during April-November 2024* is USD 251.94 Billion as compared to USD 220.08 Billion in April-November 2023. The estimated value of service imports during April-November 2024* is USD 132.47 Billion as compared to USD 116.01 Billion in April-November 2023. The services trade surplus for April-November 2024* is USD 119.48 Billion as compared to USD 104.07 Billion in April-November 2023. Fig 8: Services Trade during April-November 2024*
Exports of Rice (95.18%), Electronic Goods (54.72%), Tobacco (50.48%), Jute Mfg. Including Floor Covering (36.13%), Cashew (23.61%), Meat, Dairy & Poultry Products (21.38%), Marine Products (17.82%), Coffee (16.31%), Tea (15%), Engineering Goods (13.75%), Plastic & Linoleum (10.91%), Rmg Of All Textiles (9.81%), Other Cereals (7.4%), Spices (6.1%), Man-Made Yarn/Fabs./Made-Ups Etc. (4.88%), Cereal Preparations & Miscellaneous Processed Items (2.71%), Carpet (2.4%), Oil Seeds (2.19%), Cotton Yarn/Fabs./Made-Ups, Handloom Products Etc. (2.02%), Drugs & Pharmaceuticals (1.12%) and Leather & Leather Products (0.73%) record positive growth during November 2024 over the corresponding month of last year. Imports of Leather & Leather Products (-41.59%), Coal, Coke & Briquettes, Etc. (-29.31%), Iron & Steel (-28.63%), Dyeing/Tanning/Colouring Mtrls. (-5.26%), Transport Equipment (-5.23%), Pearls, Precious & Semi-Precious Stones (-3.27%), Metaliferrous Ores & Other Minerals (-0.86%) record negative growth during November 2024 over the corresponding month of last year. Services exports is estimated to grow by 14.48 percent during April-November 2024* over April-November 2023. Top 5 export destinations, in terms of change in value, exhibiting positive growth in November 2024 vis a vis November 2023 are U Arab Emts (11.38%), Australia (64.38%), Italy (37.71%), Singapore (22.88%) and Malaysia (27.31%). Top 5 export destinations, in terms of change in value, exhibiting positive growth in April-November 2024 vis a vis April-November 2023 are U Arab Emts (15.25%), Netherland (23.04%), U S A (5.27%), Singapore (20.7%) and U K (15.21%). Top 5 import sources, in terms of change in value, exhibiting growth in November 2024 vis a vis November 2023 are Switzerland (360.02%), U Arab Emts (109.57%), South Africa (217.33%), Australia (71.91%) and Saudi Arab (35.64%). Top 5 import sources, in terms of change in value, exhibiting growth in April-November 2024 vis a vis April-November 2023 are U Arab Emts (60.84%), China P Rp (9.81%), Russia (9.22%), Switzerland (21.83%) and Taiwan (42.82%). |
|||||||||||||||||||||||||||||||||||||||||||||||||||||||||||||||||||||||||||||||||||||||
 9911796707

