| News | ||||||||||||||||||||||||||||||||||||||||||||||||||||||||||||||||||||||||||||||||||||||||||||||||||||||||||||||||||||||||||||||||||||||||||||||||||||||||||||||||||||||||||||||||||||||||||||||||||||||||||||||||
|
|
||||||||||||||||||||||||||||||||||||||||||||||||||||||||||||||||||||||||||||||||||||||||||||||||||||||||||||||||||||||||||||||||||||||||||||||||||||||||||||||||||||||||||||||||||||||||||||||||||||||||||||||||
SHARE OF GOVERNMENT HEALTH EXPENDITURE IN TOTAL HEALTH EXPENDITURE INCREASES FROM 28.6 PER CENT IN FY14 TO 40.6 PER CENT IN FY19 |
||||||||||||||||||||||||||||||||||||||||||||||||||||||||||||||||||||||||||||||||||||||||||||||||||||||||||||||||||||||||||||||||||||||||||||||||||||||||||||||||||||||||||||||||||||||||||||||||||||||||||||||||
| 31-1-2023 | ||||||||||||||||||||||||||||||||||||||||||||||||||||||||||||||||||||||||||||||||||||||||||||||||||||||||||||||||||||||||||||||||||||||||||||||||||||||||||||||||||||||||||||||||||||||||||||||||||||||||||||||||
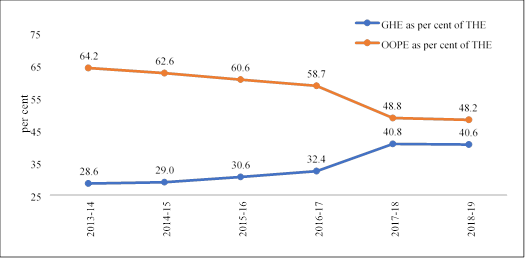
SHARE OF GOVERNMENT HEALTH EXPENDITURE IN TOTAL HEALTH EXPENDITURE INCREASES FROM 28.6 PER CENT IN FY14 TO 40.6 PER CENT IN FY19 DECLINE IN OUT-OF-POCKET EXPENDITURE AS A PERCENTAGE OF TOTAL HEALTH EXPENDITURE FROM 64.2% (IN FY14) TO 48.2% (IN FY19) In a significant milestone, depicting the importance given by the Government on health expenditure and ensuring the provision of quality health facilities to citizens, the share of government health expenditure in total health expenditure has increased from 28.6 per cent in FY14 to 40.6 per cent in FY19. Noting that India is entering the Amrit Kal with better-equipped schools, affordable healthcare, towards attaining different SDGs and the outcomes thereof, these significant figures have been highlighted in the Economic Survey 2022-23 tabled in Parliament by Smt Nirmala Sitharaman, Union Minister for Finance and Corporate Affairs, here today. The document also reports a concomitant decline in out-of-pocket expenditure as a percentage of total health expenditure from 64.2 per cent in FY14 to 48.2 per cent in FY19. The Survey also shows the hike in the share of expenditure on health in the total expenditure on social services, which has increased from 21 per cent in FY19 to 26 per cent in FY23 (BE). This underscores the rising importance of public healthcare and social security in ensuring universal health coverage.
This is aligned with the National Health Policy, 2017 which envisages “the attainment of the highest possible level of health and well-being for all at all ages, through a preventive and promotive healthcare orientation in all developmental policies, and universal access to good quality healthcare services without anyone having to face financial hardship as a consequence. This would be achieved through increasing access, improving quality, and lowering the cost of healthcare delivery.” Accordingly, the Policy recommended an increase in the Government’s health expenditure from the existing 1.2 per cent to 2.5 per cent of GDP by 2025. Also, the Fifteenth Finance Commission, in its report, had recommended that public health expenditure of Union and States together should be increased in a progressive manner to reach 2.5 per cent of GDP by 2025 (FFC report, para 9.41, iii). In keeping with this objective, Central and State Governments’ budgeted expenditure on the health sector reached 2.1 per cent of GDP in FY23 (BE) and 2.2 per cent in FY22 (RE), against 1.6 per cent in FY21. Trends in social services expenditure by General Government (Combined Centre and States) Rs. Crore
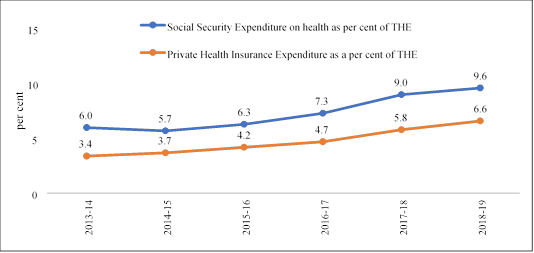
The ratios to GDP at current market prices are based on 2011-12 base till 2021-22. GDP for 2022-23 is as per Union Budget 2022-23. Sources: Budget Documents of Union and State Governments. The National Health Account (NHA) estimates for FY19 show that there has been an increase in the share of Government Health Expenditure (GHE) in the total GDP from 1.2 per cent in FY14 to 1.3 per cent in FY19. Additionally, the share of GHE in Total Health Expenditure (THE) has also increased over time, standing at 40.6 per cent in FY19, substantially higher than 28.6 per cent in FY14. Overall, for FY19, Total Health Expenditure (THE) for India is estimated to be Rs.5,96,440 crore (3.2 per cent of GDP and Rs.4,470 per capita). Current Health Expenditure (CHE) is Rs.5,40,246 crore (90.6 per cent of THE) and capital expenditures is Rs.56,194 crore (9.4 per cent of THE). Of the Government Health Expenditure (GHE), Union Government’s share is 34.3 per cent and the State Governments’ share is 65.7 per cent. In sync with the focus on providing healthcare services to all, which comprises one of the policy recommendations of the National Health Policy 2017, the Government is focusing on primary healthcare expenditure which has increased from 51.1 per cent in FY14 to 55.2 per cent in FY19. This not only ensures quality services at the grassroots level but also reduces the chances of ailments requiring secondary or tertiary healthcare services. Between FY14 and FY19, the share of primary and secondary care in the GHE increased from 74.4 per cent to 85.7 per cent. On the other hand, share of primary and secondary care in private health expenditure has declined from 82.0 per cent to 70.2 per cent during the same period. The social security expenditure on health, which includes the social health insurance programme, government-financed health insurance schemes, and medical reimbursements made to government employees, has increased from 6 per cent in FY14 to 9.6 per cent in FY19. The Economic Survey notes that this is a significant increase which shows that the citizens are better equipped and better provided in terms of healthcare at their doorstep making it more accessible. Due to several such steps, Out of-Pocket Expenditure (OOPE) as a percentage of THE has declined substantially from 64.2 per cent in FY14 to 48.2 per cent in FY19. Government Health Expenditure (GHE) and Out of Pocket Expenditure (OOPE) as per cent of Total Health Expenditure (THE)
Social Security Expenditure and Private Health Insurance Expenditure as per cent of Total Health Expenditure (THE)
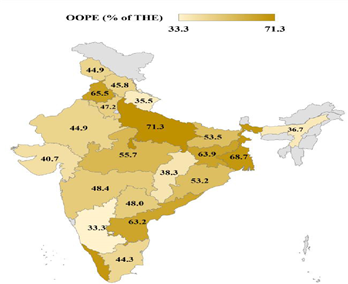
Source: National Health Accounts, MoHFW Out of Pocket Expenditure as per cent of Total Health Expenditure - Statewise for 2018-19 (Note: Jammu and Kashmir represents the erstwhile J&K including Ladakh Source: National Health Accounts 2018-19, MoHFW)
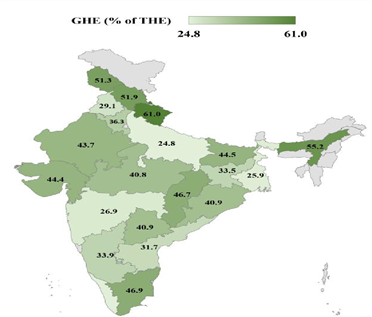
Government Health Expenditure as per cent of Total Health Expenditure – State-wise for 2018-19 (Note: Jammu and Kashmir represents the erstwhile J&K including Ladakh Source: National Health Accounts 2018-19, MoHFW)
|
||||||||||||||||||||||||||||||||||||||||||||||||||||||||||||||||||||||||||||||||||||||||||||||||||||||||||||||||||||||||||||||||||||||||||||||||||||||||||||||||||||||||||||||||||||||||||||||||||||||||||||||||
 9911796707

